Columbus Single-Family Rental Market Update
2026An operator's view of the Columbus, Ohio metro single-family rental market — rent trends, neighborhood yields, regulatory shifts, and the 2026 investor playbook.
Executive Summary
Columbus remains one of the strongest single-family rental markets in the Midwest entering 2026, but the investor playbook looks different than it did in 2025. Intel's New Albany semiconductor project has delayed production start from 2025 to 2030–2031. The Columbus Rental Registry passed in April 2026, introducing new compliance requirements for every residential rental in the city. Franklin County's 2026 Triennial Update delivered updated assessed values in June, raising residential valuations by about 9% on average.
Through these shifts, market fundamentals remain intact. Median home prices reached $350,000 across the Columbus & Central Ohio Regional MLS by May 2026 — roughly 20% below the national median. Year-over-year price growth has moderated to a healthy 4.3%. Rent growth continues to outperform the national average, and occupancy in well-managed properties remains above 95%. Inventory has improved meaningfully, climbing to roughly 5,200 homes and pushing months of supply to 2.0, giving disciplined investors more room to underwrite properly and negotiate from strength.
The 2026 opportunity is different from the 2021–2023 boom. This is a year that rewards careful acquisition, realistic underwriting, and operational excellence rather than momentum-driven buying.
At a Glance · Columbus SFR Market, H1 2026
Columbus Housing Market Overview
Columbus's housing market enters 2026 in a more balanced posture than it held through most of 2024 and 2025. According to the Columbus REALTORS May 2026 Local Market Update, median sale price across the Columbus & Central Ohio Regional MLS reached $350,000 in May, up 4.3% year-over-year after firming steadily through the first half from $319,900 in January. Inventory improved to 5,223 homes for sale — up roughly 8% year-over-year — and months of supply rose to 2.0, still well below the 6-month threshold that defines a balanced market.
Days on market followed the usual seasonal path. Homes took 46 to 49 days to sell in the winter months, then compressed to 29 days by May as the spring market arrived — though that still ran slightly longer than a year earlier as inventory built. Buyers have more breathing room, but sellers still receive an average of nearly 99% of their original list price.

For investors, this is the environment that rewards patience over speed. Properties that would have drawn five offers in 48 hours in 2022 now sit on the market long enough to underwrite properly, negotiate, and close without paying top-of-market prices.
Rental Market Performance
The Columbus single-family rental market continues to outperform national averages on both rent growth and occupancy. Average apartment rent in Columbus reached $1,365 as of mid-2026, up about 2% year-over-year, while three-bedroom unit rents average $1,725. Single-family detached rentals typically command higher rents than comparable apartments, with three-bedroom SFRs in desirable Columbus submarkets leasing in the $1,750 to $2,200 range depending on condition and neighborhood.
Arbor's latest SFR report (Q2 2026) shows national occupancy at 93.9% and cap rates rising to 7.4% — a tenth straight quarterly increase — as home-price appreciation slowed, while national SFR rents grew 2.6% year-over-year. Columbus fundamentals compare favorably on both occupancy and rent growth.


Key Market Metrics
| Metric | Columbus H1 2026 | National Context |
|---|---|---|
| Median home sale price | $350,000 | ~20% below nat'l median |
| YoY price growth | +4.3% | Nat'l +1.8% (NAR, Jun) |
| Median days on market | 29–49 days | Seasonal H1 range |
| Months of supply | 2.0 months | Balanced = 6 months |
| Avg apartment rent | $1,365 | ~22% below nat'l avg |
| 3BR apartment rent | $1,725 | SFR typically higher |
| YoY rent growth | +2.2% to +4.0% | Nat'l SFR +2.6% (Arbor) |
| Projected occupancy | 95%+ (well-managed) | Nat'l SFR ~93.9% |
Sources: Columbus REALTORS MLS (May 2026), RentCafe/Yardi Matrix (mid-2026), Arbor Q2 2026 SFR Report, MMG Real Estate Advisors, Redfin, Axios Columbus 2026.

Best Neighborhoods for Investment in 2026
Not every part of Columbus behaves the same way. Investor strategy should match neighborhood fundamentals. Below are the five categories to watch in 2026, with typical return profiles and operational considerations.

High-Yield Value Neighborhoods
For investors prioritizing monthly cash flow, these east-side and value-tier submarkets offer the strongest rent-to-price ratios in RLPM's service area. Whitehall and Eastmoor combine affordable entry points with steady workforce-tenant demand, while Blacklick and Reynoldsburg pair lower purchase prices with reliable east-side rental demand. Newark, on the Intel corridor, is an emerging value market worth watching on a longer horizon.
Emerging Suburban Corridors
First-ring suburbs offer the cleanest balance of affordability and rental demand. Reynoldsburg deserves particular attention in 2026: the city has seen notable year-over-year sales activity increases, and its affordable entry points combined with solid rental demand make it a sweet spot for investors building a Columbus portfolio.
Southern Growth Areas
Columbus's southern suburbs continue to offer strong fundamentals for investors prioritizing tenant stability. Larger lots, lower property taxes than north-side suburbs, and school districts that attract family renters who stay for multiple lease terms. Proximity to Honda's large Marysville manufacturing complex, area data-center operations, and Anduril's new Arsenal-1 drone plant near Rickenbacker all add to workforce housing demand.
Affluent Suburbs · Appreciation Plays
For investors focused on long-term appreciation and premium tenants, the traditional Columbus prestige suburbs remain best-in-class. Dublin's median home price sits around $615,000. Cash flow is thin — higher entry prices and higher property taxes compress initial yields — but lease renewal rates are the highest in the metro, vacancy is minimal, and appreciation has been steady for decades.
Employer-Driven Growth Plays
One change from last year's report: the Licking County story has shifted. With Intel's production start pushed to 2030–2031, the short-term speculation window on New Albany / Johnstown agricultural land has closed. Land that jumped 10x in value between 2022 and 2024 is now priced for patient capital rather than quick flips. Investors still drawn to employer-growth plays should look at Marysville, Sunbury, and Johnstown — but on multi-year horizons rather than quarterly cycles.
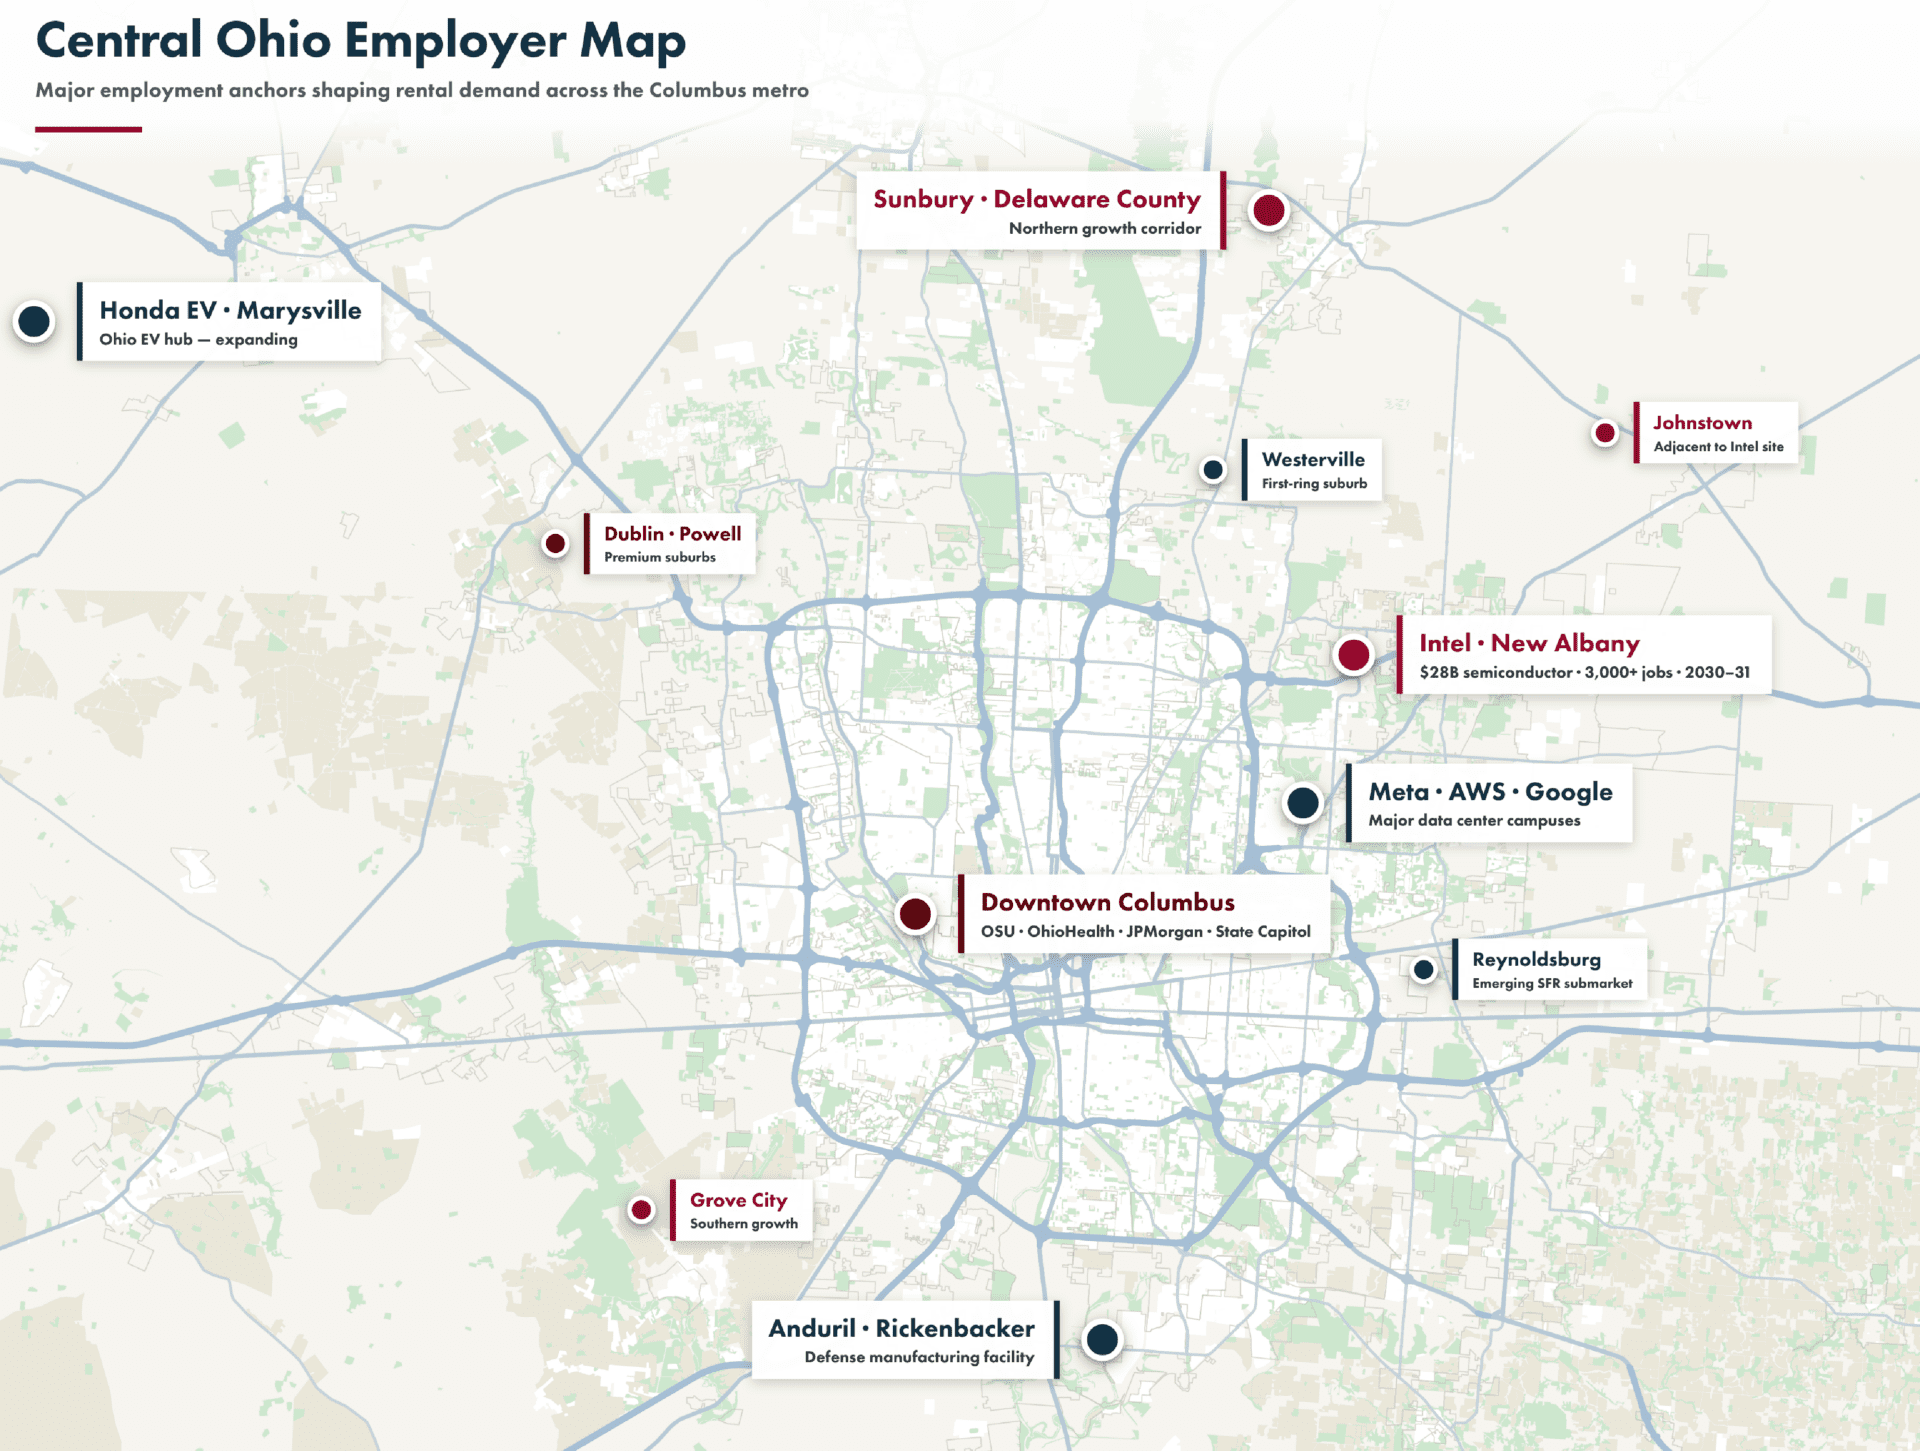
Economic & Employment Drivers
The fundamentals supporting Columbus rental demand remain firmly intact, even with the Intel timeline shift.


Healthcare
OhioHealth · Nationwide Children's · OSU Wexner Medical Center
Financial Services
JPMorgan Chase · Nationwide Insurance · Huntington Bank
Education & Government
The Ohio State University (largest metro employer) · Ohio state agencies
Technology & Manufacturing
Google · Meta · AWS data centers · Honda (Marysville) · Anduril Industries
Intel · Patience, Not Panic
Intel's roughly $20 billion first-phase semiconductor project in New Albany remains set for a 2030–2031 production start, down from the original 2025 target. Construction continues: through 2025, contractor Bechtel logged more than 9.4 million work hours on site, with active hiring into 2026. Once operational, the first two fabs are projected to create about 3,000 permanent Intel jobs plus roughly 7,000 construction jobs and thousands of ancillary positions.
Regulatory Updates Landlords Need to Know
Four major regulatory shifts are reshaping the Columbus rental landscape in 2026. Investors who stay current on these changes protect profitability and avoid costly compliance issues.
01 · Columbus Rental Registry · Passed April 2026
The biggest regulatory change of 2026. Columbus City Council passed the residential rental registry ordinance on April 20, 2026 by an 8-1 vote, creating Columbus City Code Chapter 4515 and administered by the Department of Building & Zoning Services. Every residential rental dwelling unit within the City of Columbus must now be registered annually, with owners providing:
- Name, address, email, and telephone number of the owner (or ownership entity)
- Number of rental dwelling units and average rent
- A local operator and named emergency contact
- An annual affidavit affirming that critical building systems comply with local housing, building, health, and fire codes
- Any inspection documentation from the past year
An annual registration fee of $15 per unit applies, capped at $1,500 per property. Rather than proactive individual-unit inspections (which faced constitutional concerns), the ordinance pairs annual registration with routine inspections of common areas and critical building systems roughly every three years; individual-unit inspections are triggered only when a property is placed in “conditional” status. Operating without valid registration carries a civil penalty of about $2 per unit per day. Implementation details — the registration portal, first filing deadline, and enforcement start date — are still being finalized by Building & Zoning Services as of mid-2026.
02 · Franklin County 2026 Triennial Update
Three years after the 2023 Sexennial Reappraisal drove residential values up 41% on average (with some school districts seeing 60%+ increases), the 2026 Triennial Update landed in June 2026. Tentative updated values were mailed and posted online in June, showing an average residential increase of about 9% — far milder than the 2023 jump. Informal review sessions run July through September 2026. Final values are set in December 2026 and take effect for Tax Year 2026 bills paid in 2027.
Unlike the 2023 sexennial, which was a full reappraisal, the triennial update uses mass appraisal methods based on sales from the past three years. Investors who acquired properties post-2023 should pay particular attention to the new valuations and file Board of Revision complaints by March 31, 2027 if values appear overstated.
03 · Source-of-Income Protection
Columbus's source-of-income discrimination ordinance (in effect since 2024) prohibits landlords from refusing to rent to applicants based on a legal source of income — most notably Housing Choice Vouchers (Section 8). Screening criteria must apply consistently across all applicants regardless of income source. Investors who have not updated their screening protocols since 2023 should review them against current Columbus requirements.
04 · Security Deposits & Short-Term Rentals
New Columbus tenants have the right to pay security deposits in installments over three or six months, which affects initial cash flow planning. Short-term rental operators continue to face increased scrutiny: a City of Columbus STR permit is required, lodging excise taxes apply (combined rates commonly fall between 9% and 15%), and several suburbs including Upper Arlington and Westerville have significantly limited or banned Airbnb operations.
2026 Compliance Quick Checklist
2026 Investment Outlook
Columbus enters 2026 as one of the most stable real estate markets in the Midwest. Home values are projected to rise 2% to 5% through the year, driven by steady population growth, low construction starts (limiting new supply), and continued in-migration from higher-cost metros. MMG Real Estate Advisors projects Columbus rent growth to approach 4% in 2026, continuing to outperform the national average.

The 2026 Investor Playbook
| Strategy | Target Neighborhoods | Profile |
|---|---|---|
| Emerging cash-flow | Reynoldsburg · Whitehall · Eastmoor · Blacklick | Attractive entry points before prices fully reflect demand |
| Workforce housing | Grove City · Groveport · Canal Winchester | Strong rents, reliable tenant demand, attractive yields |
| Long-term appreciation | Marysville · Sunbury · Johnstown | Employer-driven growth on multi-year horizons |
| Premium hold assets | Dublin · Powell · New Albany · Upper Arlington · Lewis Center | Low-volatility appreciation for decade-plus horizons |
With more inventory on the market than at any point in the past five years, 2026 presents genuine opportunities for strategic investors willing to underwrite carefully, negotiate thoughtfully, and hold for the long term. The key shift: buy on current cash flow and realistic appreciation projections, not on speculation about Intel timelines or employer announcements that may or may not materialize on schedule.
Frequently Asked Questions
Is Columbus a good market for single-family rental investors in 2026?
Yes, with the understanding that 2026 rewards disciplined acquisition rather than momentum-driven buying. Columbus continues to outperform the national average on rent growth and occupancy, median home prices are roughly 20% below the national median, and the metro's diversified economy provides recession resilience. Returns are more moderate than the 2021–2023 boom years but sustainable.
How did Intel's delay affect the Columbus real estate market?
The production start was pushed from 2025 to 2030–2031, which removed a near-term catalyst but did not change long-term fundamentals. Land speculation near New Albany and Johnstown has cooled significantly, but construction at the Intel site continues and the employment impact (3,000+ direct jobs once operational) remains on track on a longer timeline.
What's the typical cap rate for Columbus single-family rentals in 2026?
Value-tier neighborhoods (Whitehall, Eastmoor, Blacklick) typically generate 7% to 10% cap rates. First-ring suburbs (Reynoldsburg, Gahanna, Westerville) typically generate 6% to 8%. Premium suburbs (Dublin, Powell, New Albany) typically generate 4% to 6% and are purchased primarily for appreciation. National SFR cap rates rose to 7.4% in early 2026 per Arbor.
Are property taxes in Columbus higher than the national average?
Yes. Franklin County's effective property tax rate is approximately 1.67% of market value, ranked 252nd of 3,143 U.S. counties. The median property tax bill is around $2,592 annually on a home valued at the county median. Investors underwriting Columbus properties should account for property tax carrying costs meaningfully higher than Sun Belt markets.
How will the 2026 Franklin County Triennial Update affect property taxes?
The triennial update adjusts assessed values based on sales from the past three years. Assessment notices were mailed in June 2026 (about a 9% average residential increase), with informal review July through September and final values taking effect for Tax Year 2026 bills paid in 2027. Review new valuations carefully and file Board of Revision complaints by March 31, 2027 if values appear overstated.
How quickly do single-family homes lease in Columbus in 2026?
Well-priced single-family rentals in desirable Columbus submarkets lease in 14 to 21 days on average once rent-ready. Homes priced above market or in poor condition can sit 45+ days. RLPM tracks current days-on-market data in real time on its live KPI scorecard at rlpmg.com/key-performance-indicators.
How much cash reserve should I have for a Columbus rental property?
Most experienced Columbus investors target a reserve of roughly six months of rent per property to cover maintenance, turnover costs, and unexpected capital expenses. RLPM requires a maintenance reserve of $350 to $1,500 per unit depending on the service plan, which sits on top of the owner's broader liquidity cushion. Reserves matter most in the first year of ownership, when surprise repairs and initial turns tend to cluster.
Should I accept Section 8 (Housing Choice Voucher) tenants in Columbus?
Columbus's source-of-income protection ordinance (in effect since 2024) means landlords cannot refuse applicants solely because they use a Housing Choice Voucher. Voucher tenants must still meet consistent, non-discriminatory screening criteria. Many investors find that voucher tenants produce reliable, government-backed rent payments once properly screened, though the program adds inspection and paperwork requirements that benefit from professional management.
What's the difference between managing a Columbus property yourself versus hiring a PM company?
Self-management can work for hands-on investors with one or two nearby properties, time to handle tenant calls, and familiarity with Ohio landlord-tenant law. Professional management becomes valuable at scale (3+ units), for out-of-state investors, for owners who want to reclaim their time, or when dealing with evictions, Fair Housing compliance, and the new rental registry. The real cost comparison isn't fees versus free; it's what your time is worth and what a missed lease-up week or bad tenant placement actually costs.
Ready to Invest in Columbus?

Our clients include long-term investors, accidental landlords, first-time buyers, and out-of-state owners managing Columbus portfolios remotely. We specialize in single-family homes and small multifamily properties under 100 units across the Columbus metro.
What Makes RLPM Different
- $0 Leasing Fees across all three pricing plans. Most Columbus PM companies charge 50% to 100% of the first month's rent every time a tenant turns over. RLPM charges nothing.
- Flat-Rate Pricing. Three tiers (Passive $117/mo · Standard $137/mo · Premium $184/mo per unit) with transparent line-item fees.
- Live KPI Scorecard. Published publicly at rlpmg.com/key-performance-indicators — days on market, renewal rate, occupancy, and rent collection updated in real time.
- In-House Maintenance. $84/hr plus $15 trip charge, with quarterly property inspections included in every plan.
- Local Depth. Based in Gahanna, managing 750+ units across 30+ Columbus neighborhoods.
Schedule a Consultation
Discuss your property, your goals, and whether RLPM is the right fit for your portfolio.
Free Consultation →Get a Rent Estimate
Get a data-driven rent estimate based on current Columbus market conditions.
Free Rent Evaluation →Methodology & Sources
This report synthesizes publicly available market data, government-source statistics, and industry research current as of July 2026. All figures reflect the most recent data available at time of publication. Market conditions change; investors should verify current metrics before making acquisition decisions.
Primary Data Sources
About RL Property Management
RL Property Management Group (RLPM) is a Columbus, Ohio-based residential property management company founded in 2013. The firm manages approximately 750 single-family homes and small multifamily properties across the Columbus metro area, with a team of 33 employees and a specialization in serving intentional, long-term investors.
RLPM is headquartered in Gahanna at 750 Cross Pointe Rd, STE B, and can be reached at 614.725.3059 or info@rlpmg.com.
Founded
2013 · Columbus, Ohio
Portfolio
~750 units · 30+ neighborhoods
Team
33 employees · In-house maintenance
Specialty
Single-family + small multifamily (<100 units)
Report Disclaimer
This report is for informational purposes only and does not constitute investment, legal, tax, or financial advice. Real estate investments carry risk, including the potential loss of principal. Market data reflects conditions as of mid-2026 and is subject to change. Regulatory information is informational only; consult a qualified Ohio attorney for specific compliance questions. Past performance does not guarantee future results. Investors should conduct independent due diligence and consult qualified professionals before making any investment decisions.
© 2026 RL Property Management Group, Inc. All rights reserved. Licensed Ohio Real Estate Brokerage