 Columbus remains one of the strongest single-family rental markets in the Midwest, but the 2026 investor playbook looks different from 2025. Intel is delayed. The rental registry passed. Property taxes are reappraising. Here’s what matters and what to do about it.
TL;DR
Columbus single-family rental fundamentals remain strong in Q1 2026: median home price $335,000 (up 4.7% year-over-year), median days on market 46-49 days, and rent growth continuing to outperform the national average. Intel’s New Albany plant production start has been pushed to 2030-2031, which removes a short-term catalyst but does not change long-term demand fundamentals. The Columbus Rental Registry passed in April 2026 and adds new annual compliance requirements. Franklin County’s 2026 Triennial Update is underway and will adjust values again. The best investor moves in 2026 are buying in emerging workforce neighborhoods, avoiding speculative Licking County land plays, and keeping an eye on regulatory compliance.
Key Takeaways
- Columbus rent growth has outperformed the national average for four consecutive quarters, but the market is cooling toward steady rather than surging.
- Intel’s production start has slipped from 2025 to 2030-2031, which means the real estate story around Licking County has shifted from “land rush” to “patient capital.”
- The Columbus Rental Registry (passed April 2026) requires annual registration of every residential rental unit in the city, with an affidavit of code compliance.
- Franklin County’s 2026 Triennial Update will produce new assessed values this summer, three years after the 41% reappraisal jump of 2023.
- Top 2026 investor neighborhoods include Reynoldsburg, Groveport, and Hilltop for cash flow, plus Marysville, Johnstown, and Sunbury for long-term appreciation driven by employer activity.
In This Report
Columbus Housing Market Overview: Q1 2026
Columbus’s housing market enters 2026 in a more balanced posture than it held through most of 2024 and 2025. According to the Columbus REALTORS March 2026 Local Market Update, median sale price across the Columbus & Central Ohio Regional MLS hit $335,000 in March, up 4.7% year-over-year. Inventory improved to 4,067 homes for sale (up 32% from a year earlier in Columbus Corp), but months of supply still sits at just 1.6 — well below the 6-month threshold that defines a balanced market.
Days on market have lengthened. Homes now average 46 to 49 days to sell across the metro, compared to 43 days a year earlier — a 14% to 18% increase. Buyers have more breathing room, but sellers still receive an average of 97% of their original list price. Columbus remains seller-leaning, but the edge is thinner than it was two years ago.
Columbus’s median sale price is 33% below the national average. The affordability advantage is the story that keeps working.
Year-over-year price appreciation has moderated from the double-digit pace of the early post-pandemic years to the 3% to 5% range that characterizes a healthy, sustainable market. Redfin reports Columbus home prices up 5.9% in February 2026, with a median sale price of $286,000 for the city proper. Zillow forecasts continued moderate growth through 2026, with home values potentially peaking around 1.9% growth by August and the broader trajectory supportive of long-term investors.
For investors, this is the environment that rewards patience over speed. Properties that would have drawn five offers in 48 hours in 2022 now sit on the market long enough to underwrite properly, negotiate, and close without paying top-of-market prices.
Rental Market Performance
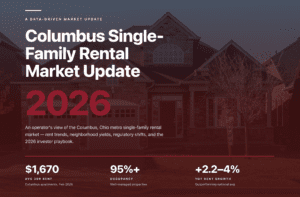
The Columbus single-family rental market continues to outperform national averages on both rent growth and occupancy. Average apartment rent in Columbus reached $1,341 as of February 2026, up 2.24% year-over-year, while three-bedroom unit rents average $1,670. Single-family detached rentals typically command higher rents than comparable apartments, with three-bedroom SFRs in desirable Columbus submarkets leasing in the $1,750 to $2,200 range depending on condition and neighborhood.
National context matters here. National SFR rents grew just 2.6% year-over-year in January 2026 per Arbor, with national occupancy at 94.0% and cap rates rising to 7.3% as home price appreciation slowed. Columbus fundamentals continue to compare favorably on both occupancy and rent growth.
| Columbus SFR Metric | Q1 2026 | National Context |
|---|---|---|
| Median home sale price (MLS) | $335,000 | ~33% below national avg |
| Year-over-year price growth | +4.7% | Nat’l avg ~3% (NAR forecast) |
| Median days on market | 46–49 days | Similar to national norms |
| Months of supply | 1.6 months | Balanced = 6 months |
| Avg apartment rent | $1,341 | ~22% below national avg |
| 3BR apartment rent | $1,670 | SFR typically higher |
| Year-over-year rent growth | +2.2% to +4.0% | Nat’l SFR +2.6% (Arbor) |
| Projected occupancy | 95%+ in well-managed | Nat’l SFR ~94.0% |
Sources: Columbus REALTORS MLS (March 2026), RentCafe/Yardi Matrix (February 2026), Arbor Q1 2026 SFR Report, MMG Real Estate Advisors, Redfin, Axios Columbus Q1 2026 market data.
Tenant demand is holding. Arbor’s analysis shows SFR delinquencies falling to 1.6% nationally in October 2025, down from 2.1% a year earlier. In Columbus, well-priced single-family properties in desirable submarkets continue to lease in 14 to 21 days on average. RLPM’s live KPI scorecard tracks current days on market, lease renewal rate, and percent of rent collected by the fifth in real time.
The 2026 Columbus rental story is “steady outperformance.” Not thrilling, not disappointing. Just consistently better than the national baseline.
One trend worth tracking: rental demand is increasingly bifurcated by price point. Low-priced rentals grew just 0.1% year-over-year nationally in January 2026 per Cotality, while higher-priced single-family rentals grew 2.4%. In Columbus, this suggests investors targeting workforce and middle-market rentals should expect more modest rent growth than high-end suburban properties in the coming year.
Best Neighborhoods for Investment in 2026
Not every part of Columbus behaves the same way. Investor strategy should match neighborhood fundamentals. Here are the four categories to watch in 2026.
High-Yield Urban Neighborhoods: Strong Cash Flow Potential
For investors prioritizing monthly cash flow, several urban Columbus neighborhoods continue to offer the strongest rent-to-price ratios in the metro. Hilltop, South Linden, Franklinton, Whitehall, and Eastmoor all feature home prices that generate cap rates in the 7% to 10% range, with ongoing revitalization boosting long-term fundamentals.
Franklinton continues its transformation, with new mixed-use projects, breweries, and cultural hubs driving demand. Linden remains in the middle of the ONE Linden redevelopment initiative, a $50+ million investment in infrastructure, amenities, and commercial activation. These neighborhoods require active, proactive management (higher tenant turnover, more frequent maintenance calls), but investors who can operate effectively in this segment capture yields unavailable in the suburbs.
Emerging Suburban Corridors: Growth & Affordability
First-ring suburbs offer the cleanest balance of affordability and rental demand. The Morse Road / State Route 161 corridor (Northland, Gahanna, Westerville) remains attractive for entry-level investors, with home prices that support cap rates in the 6% to 8% range and a diverse tenant base drawn by proximity to employment centers. The Hamilton Road Corridor and Lincoln Village on the West Side offer mid-century single-family homes at reasonable prices for investors who can value-add through modest renovations.
Reynoldsburg deserves particular attention in 2026. The city has seen notable year-over-year sales activity increases, and its affordable entry points combined with solid rental demand make it a sweet spot for the 1-to-5-unit investor building a Columbus portfolio.
Southern Growth Areas: Family Stability
For investors prioritizing tenant stability and long lease terms, Columbus’s southern suburbs continue to offer strong fundamentals. Grove City, Canal Winchester, Lancaster, Groveport, and the Teays Valley School District feature larger lots, lower property taxes than north-side suburbs, and school districts that attract family renters who stay for multiple lease terms.
Proximity to major employers adds to the draw. Honda’s ongoing EV hub investment in Marysville extends its economic reach into southern Columbus. Facebook (Meta) operations and the Anduril defense manufacturing facility near Rickenbacker create additional demand for workforce housing within reasonable commuting distance.
Affluent Suburbs: Appreciation & Premium Tenants
For investors focused on long-term appreciation and premium tenants, the traditional Columbus prestige suburbs remain best-in-class. Dublin, Powell, New Albany, Upper Arlington, and Lewis Center (Olentangy Schools) attract high-earning professionals and families drawn by top-rated school districts, premium amenities, and established home values. Dublin’s median home price sits around $615,000 per recent market data.
Cash flow in these neighborhoods is thin by the numbers — higher entry prices and higher property taxes compress initial yields. But lease renewal rates are the highest in the metro, vacancy is minimal, and appreciation has been steady for decades. These are buy-and-hold appreciation plays, not cash flow plays.
Long-Term Appreciation Plays: Employer-Driven Growth
One change from last year’s report: the Licking County story has shifted. With Intel’s production start pushed to 2030-2031, the short-term speculation window on New Albany / Johnstown agricultural land has closed. Land that jumped 10x in value between 2022 and 2024 is now priced for patient capital rather than quick flips.
Investors still drawn to employer-growth plays should look at Marysville (Honda’s ongoing EV and battery investment), Sunbury (Delaware County growth corridor), and Johnstown (adjacent to the Intel site, priced for the long term). The housing demand from these employers is real and growing; the timeline for capturing it just extended by several years.
Economic & Employment Drivers
The fundamentals supporting Columbus rental demand remain firmly intact, even with the Intel timeline shift.
Population growth. Columbus continues to add approximately 10,000 new residents annually, driven by in-migration from higher-cost metros and a steady stream of Ohio State University graduates who stay in the city after earning their degrees. Central Ohio’s population growth has outpaced the Ohio state average for over a decade.
Employment diversity. Columbus has one of the most diversified metropolitan economies in the Midwest, anchored by healthcare (OhioHealth, Nationwide Children’s, The Ohio State University Wexner Medical Center), financial services (JPMorgan Chase, Nationwide Insurance, Huntington Bank), education (Ohio State University — the largest employer in the metro), government (state capital), and technology (Google, Meta, Amazon Web Services data centers, and expanding tech startups).
Intel: patience, not panic. Intel’s $28 billion semiconductor project in New Albany has been delayed to a 2030-2031 production start, down from the original 2025 target. However, construction continues. As of early 2025, Intel reported approximately 800 workers on site with over 1.6 million work hours completed, and the workforce is expected to grow to several thousand by year-end. Once operational, the facility is projected to create 3,000 direct jobs plus thousands of ancillary positions. For investors, this is a four-to-five-year horizon story rather than a 12-month story.
Other tech and manufacturing. Google, Meta, and Amazon Web Services all operate major data center campuses across Central Ohio. Anduril Industries is building a defense manufacturing facility near Rickenbacker Airport. Honda’s Ohio EV hub in Marysville continues expanding. These investments collectively support rental demand throughout the metro.
Columbus doesn’t depend on any single employer. That’s why it’s been one of the most recession-resistant rental markets in the country.
Regulatory Updates Landlords Need to Know
Four major regulatory shifts are reshaping the Columbus rental landscape in 2026. Investors who stay current on these changes protect profitability and avoid costly compliance issues. The information below is current as of April 2026; this is informational and not legal advice. Consult a qualified Ohio attorney for specific situations.
1. Columbus Rental Registry (Passed April 2026)
The biggest regulatory change of 2026. Columbus City Council passed the residential rental registry ordinance on April 15, 2026. Every residential rental dwelling unit within the City of Columbus must now be registered annually, with owners providing:
- Name, address, email, and telephone number of the owner (or ownership entity)
- Number of rental dwelling units and average rent
- A local operator and named emergency contact
- An annual affidavit affirming that critical building systems comply with local housing, building, health, and fire codes
- Any inspection documentation from the past year
An annual registration fee applies. The final ordinance dropped proactive individual-unit inspections (which faced constitutional concerns), but maintained the annual registration and accountability framework. RLPM published an in-depth analysis of the registry here for investors who want the full compliance breakdown.
2. Franklin County 2026 Triennial Update
Three years after the 2023 Sexennial Reappraisal drove residential values up 41% on average (with some school districts seeing 60%+ increases), the 2026 Triennial Update is now underway. Assessment notices are typically mailed in June, with informal review sessions held July through September. Final values take effect for Tax Year 2026 bills paid in 2027.
Unlike the 2023 sexennial, which was a full reappraisal, the triennial update uses mass appraisal methods based on sales from the past three years. Investors who acquired properties post-2023 should pay particular attention to the new valuations and file Board of Revision complaints by March 31, 2027 if values appear overstated.
3. Source-of-Income Protection
Columbus’s source-of-income discrimination ordinance (in effect since 2024) prohibits landlords from refusing to rent to applicants based on a legal source of income — most notably Housing Choice Vouchers (Section 8). Screening criteria must apply consistently across all applicants regardless of income source. Investors who have not updated their screening protocols since 2023 should review them against current Columbus requirements.
4. Security Deposit Installments and Short-Term Rental Rules
New Columbus tenants have the right to pay security deposits in installments over three or six months, which affects initial cash flow planning. Short-term rental operators continue to face increased scrutiny: a City of Columbus STR permit is required, lodging excise taxes apply (combined rates commonly fall between 9% and 15%), and several suburbs including Upper Arlington and Westerville have significantly limited or banned Airbnb operations. Verify current local regulations before purchasing any property intended for STR use.
2026 Investment Outlook
Columbus enters 2026 as one of the most stable real estate markets in the Midwest. Home values are projected to rise 2% to 5% through the year, driven by a combination of steady population growth, low construction starts (limiting new supply), and continued in-migration from higher-cost metros. MMG Real Estate Advisors projects Columbus rent growth to approach 4% in 2026, continuing to outperform the national average.
Mortgage rates remain the biggest swing factor. NAR Chief Economist Lawrence Yun projects mortgage rates averaging 6.1% in 2026, down from 6.4% in late 2025. Any meaningful decline below 6% would likely accelerate buying activity and push Columbus prices higher faster than the current forecast suggests.
For investors, the 2026 playbook looks different than 2025:
Emerging cash-flow neighborhoods: Franklinton, South Linden, Reynoldsburg, Hilltop — still offering attractive entry points before prices fully reflect demand.
Workforce housing: Groveport, Hilltop, Canal Winchester — rents remain strong, properties generate attractive yields, and tenant demand is reliable.
Long-term appreciation: Marysville, Sunbury, Johnstown — employer-driven growth that plays out over multi-year horizons rather than quarterly cycles.
Premium hold assets: Dublin, Powell, New Albany, Upper Arlington, Lewis Center — low-volatility appreciation plays for investors with time horizons measured in decades.
2026 rewards disciplined acquisition. The days of paying 2022 prices and trusting momentum to bail you out are over.
With more inventory on the market than at any point in the past five years, 2026 presents genuine opportunities for strategic investors willing to underwrite carefully, negotiate thoughtfully, and hold for the long term. The key shift: buy on current cash flow and realistic appreciation projections, not on speculation about Intel timelines or employer announcements that may or may not materialize on schedule.
Frequently Asked Questions
Is Columbus a good market for single-family rental investors in 2026?
Yes, with the understanding that 2026 rewards disciplined acquisition rather than momentum-driven buying. Columbus continues to outperform the national average on rent growth and occupancy, median home prices are ~33% below national averages, and the metro’s diversified economy provides recession resilience. Returns are more moderate than the 2021-2023 boom years but sustainable.
How did Intel’s delay affect the Columbus real estate market?
The production start was pushed from 2025 to 2030-2031, which removed a near-term catalyst but did not change long-term fundamentals. Land speculation near New Albany and Johnstown has cooled significantly, but construction at the Intel site continues and the employment impact (3,000+ direct jobs once operational) remains on track, just on a longer timeline.
What is the Columbus Rental Registry and when does it take effect?
Columbus City Council passed the residential rental registry ordinance on April 15, 2026. It requires every residential rental dwelling unit in the city to register annually, with information including owner contact, local operator and emergency contact, average rent, and an affidavit of code compliance. An annual registration fee applies. Implementation details including exact effective date, fee schedule, and enforcement protocols are still being finalized by the city.
What are the best Columbus neighborhoods for SFR cash flow in 2026?
Hilltop, South Linden, Franklinton, Whitehall, Eastmoor, and Reynoldsburg continue to offer the strongest rent-to-price ratios in the metro, with cap rates typically in the 7% to 10% range. These neighborhoods require active management but generate the highest monthly yields for investors who can operate effectively in the urban and first-ring suburban segments.
How will the 2026 Franklin County Triennial Update affect my property taxes?
The triennial update adjusts assessed values based on sales from the past three years, rather than doing a full reappraisal like the 2023 sexennial. Assessment notices mail in June 2026, with informal review July through September and final values taking effect for Tax Year 2026 bills paid in 2027. Investors should review new valuations carefully and file Board of Revision complaints by March 31, 2027 if values appear overstated.
Are property taxes in Columbus higher than the national average?
Yes. Franklin County’s effective property tax rate is approximately 1.67% of market value, ranked 252nd of 3,143 U.S. counties. The median property tax bill is around $2,592 annually on a home valued at the county median. Investors underwriting Columbus properties should account for property tax carrying costs that are meaningfully higher than Sun Belt markets.
What’s the typical cap rate for Columbus single-family rentals in 2026?
Cap rates vary significantly by neighborhood. Urban cash-flow neighborhoods (Hilltop, South Linden, Franklinton) typically generate 7% to 10% cap rates. First-ring suburbs (Reynoldsburg, Gahanna, Westerville entry-level) typically generate 6% to 8%. Premium suburbs (Dublin, Powell, New Albany) typically generate 4% to 6% and are purchased primarily for appreciation rather than cash flow. National SFR cap rates averaged 7.3% in Q4 2025 per Arbor.
How quickly do single-family homes lease in Columbus in 2026?
Well-priced single-family rentals in desirable Columbus submarkets continue to lease in 14 to 21 days on average once rent-ready. Homes priced above market or in poor condition can sit 45+ days. RLPM tracks current days-on-market data in real time on its live KPI scorecard.
How much cash reserve should I have for a Columbus rental property?
Most experienced Columbus investors target a reserve of roughly six months of rent per property to cover maintenance, turnover costs, and unexpected capital expenses. RLPM requires a maintenance reserve of $350 to $1,500 per unit depending on the service plan, which sits on top of the owner’s broader liquidity cushion. Reserves matter most in the first year of ownership, when surprise repairs and initial turns tend to cluster.
Should I accept Section 8 (Housing Choice Voucher) tenants in Columbus?
Columbus’s source-of-income protection ordinance (in effect since 2024) means landlords cannot refuse applicants solely because they use a Housing Choice Voucher. Voucher tenants must still meet consistent, non-discriminatory screening criteria. Many investors find that voucher tenants produce reliable, government-backed rent payments once properly screened, though the program adds inspection and paperwork requirements that benefit from professional management.
What’s the difference between managing a Columbus property yourself versus hiring a PM company?
Self-management can work for hands-on investors with one or two nearby properties, time to handle tenant calls, and familiarity with Ohio landlord-tenant law. Professional management becomes valuable at scale (3+ units), for out-of-state investors, for owners who want to reclaim their time, or when dealing with evictions, Fair Housing compliance, and the new rental registry. The real cost comparison isn’t fees versus free; it’s what your time is worth and what a missed lease-up week or bad tenant placement actually costs.
Get the Full 2026 Columbus SFR Report
Download the complete 2026 Columbus Single-Family Rental Market Report with full market data, neighborhood deep-dives, and a regulatory compliance checklist for the year ahead.
Download the Full Report (PDF)
Ready to invest in or optimize your Columbus rental portfolio?
Or get a free rent evaluation · 614.725.3059
Sources & Suggested External Links
- Columbus REALTORS March 2026 Local Market Update — MLS sales data, median prices, days on market
- RentCafe Columbus Market Trends — Current rent data and unit-size breakdowns
- Arbor Q1 2026 SFR Investment Trends Report (via CRE Daily) — National SFR cap rates, rent growth, occupancy
- MMG Real Estate Advisors 2025-2026 Columbus Forecast — Multifamily market fundamentals and rent growth projections
- WOSU: Columbus Rental Registry Coverage (April 2026) — Ordinance details and passage
- RLPM: Columbus Rental Property Registry Explained — Full landlord compliance analysis
- Engineering News-Record: Intel Delays Ohio Plant to 2030 — Confirmed new Intel timeline
- Franklin County Law Library: Columbus Landlord/Tenant Law — Current ordinances and tenant protections
- Franklin County Auditor: Reappraisal FAQ — 2026 Triennial Update process and timelines
- RL Property Management Live KPI Scorecard — Days on market, renewal rate, occupancy, rent collection
- Redfin Columbus Housing Market — City-proper median prices and market competitiveness data