We recently conducted an cost analysis examining spending in the year of 2019 across our entire portfolio of managed multifamily (2+ unit) properties.
Out of the 300+ units under our management around Columbus Ohio, this study includes just the multifamily properties (37 properties consisting of 137 units). We wanted to know how spending in the various accounting categories compared to each other. Eg – do our clients spend more on pest control, or appliances? Here are the results:
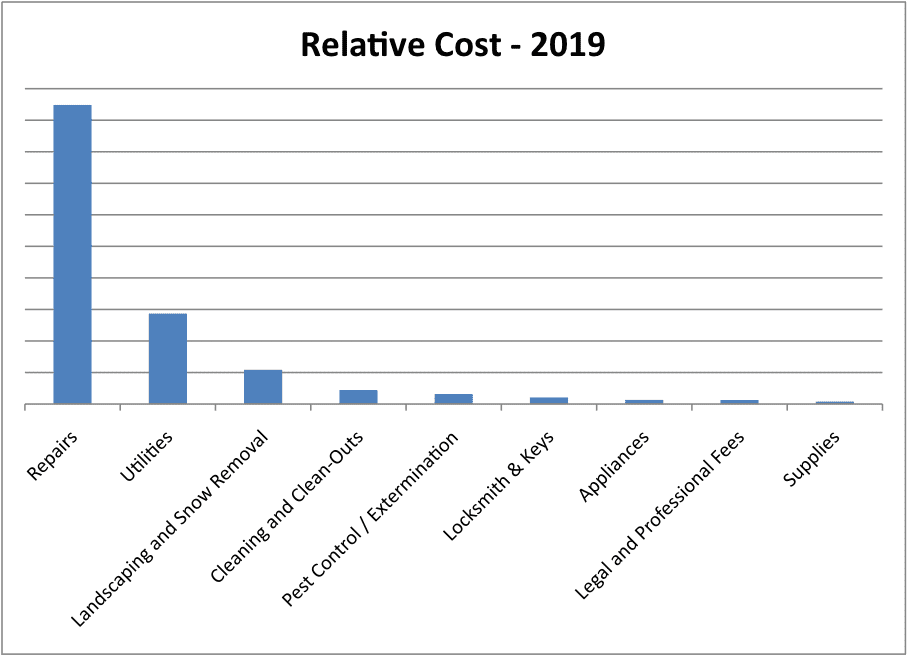
As you can see, the category of “repairs” is dominant. That certainly matched our expectations. “Repairs” covers a lot of different types of work that goes on at a rental property, including capital improvements and turnover cost.
Let’s exclude repairs and take a closer look at the remaining items:
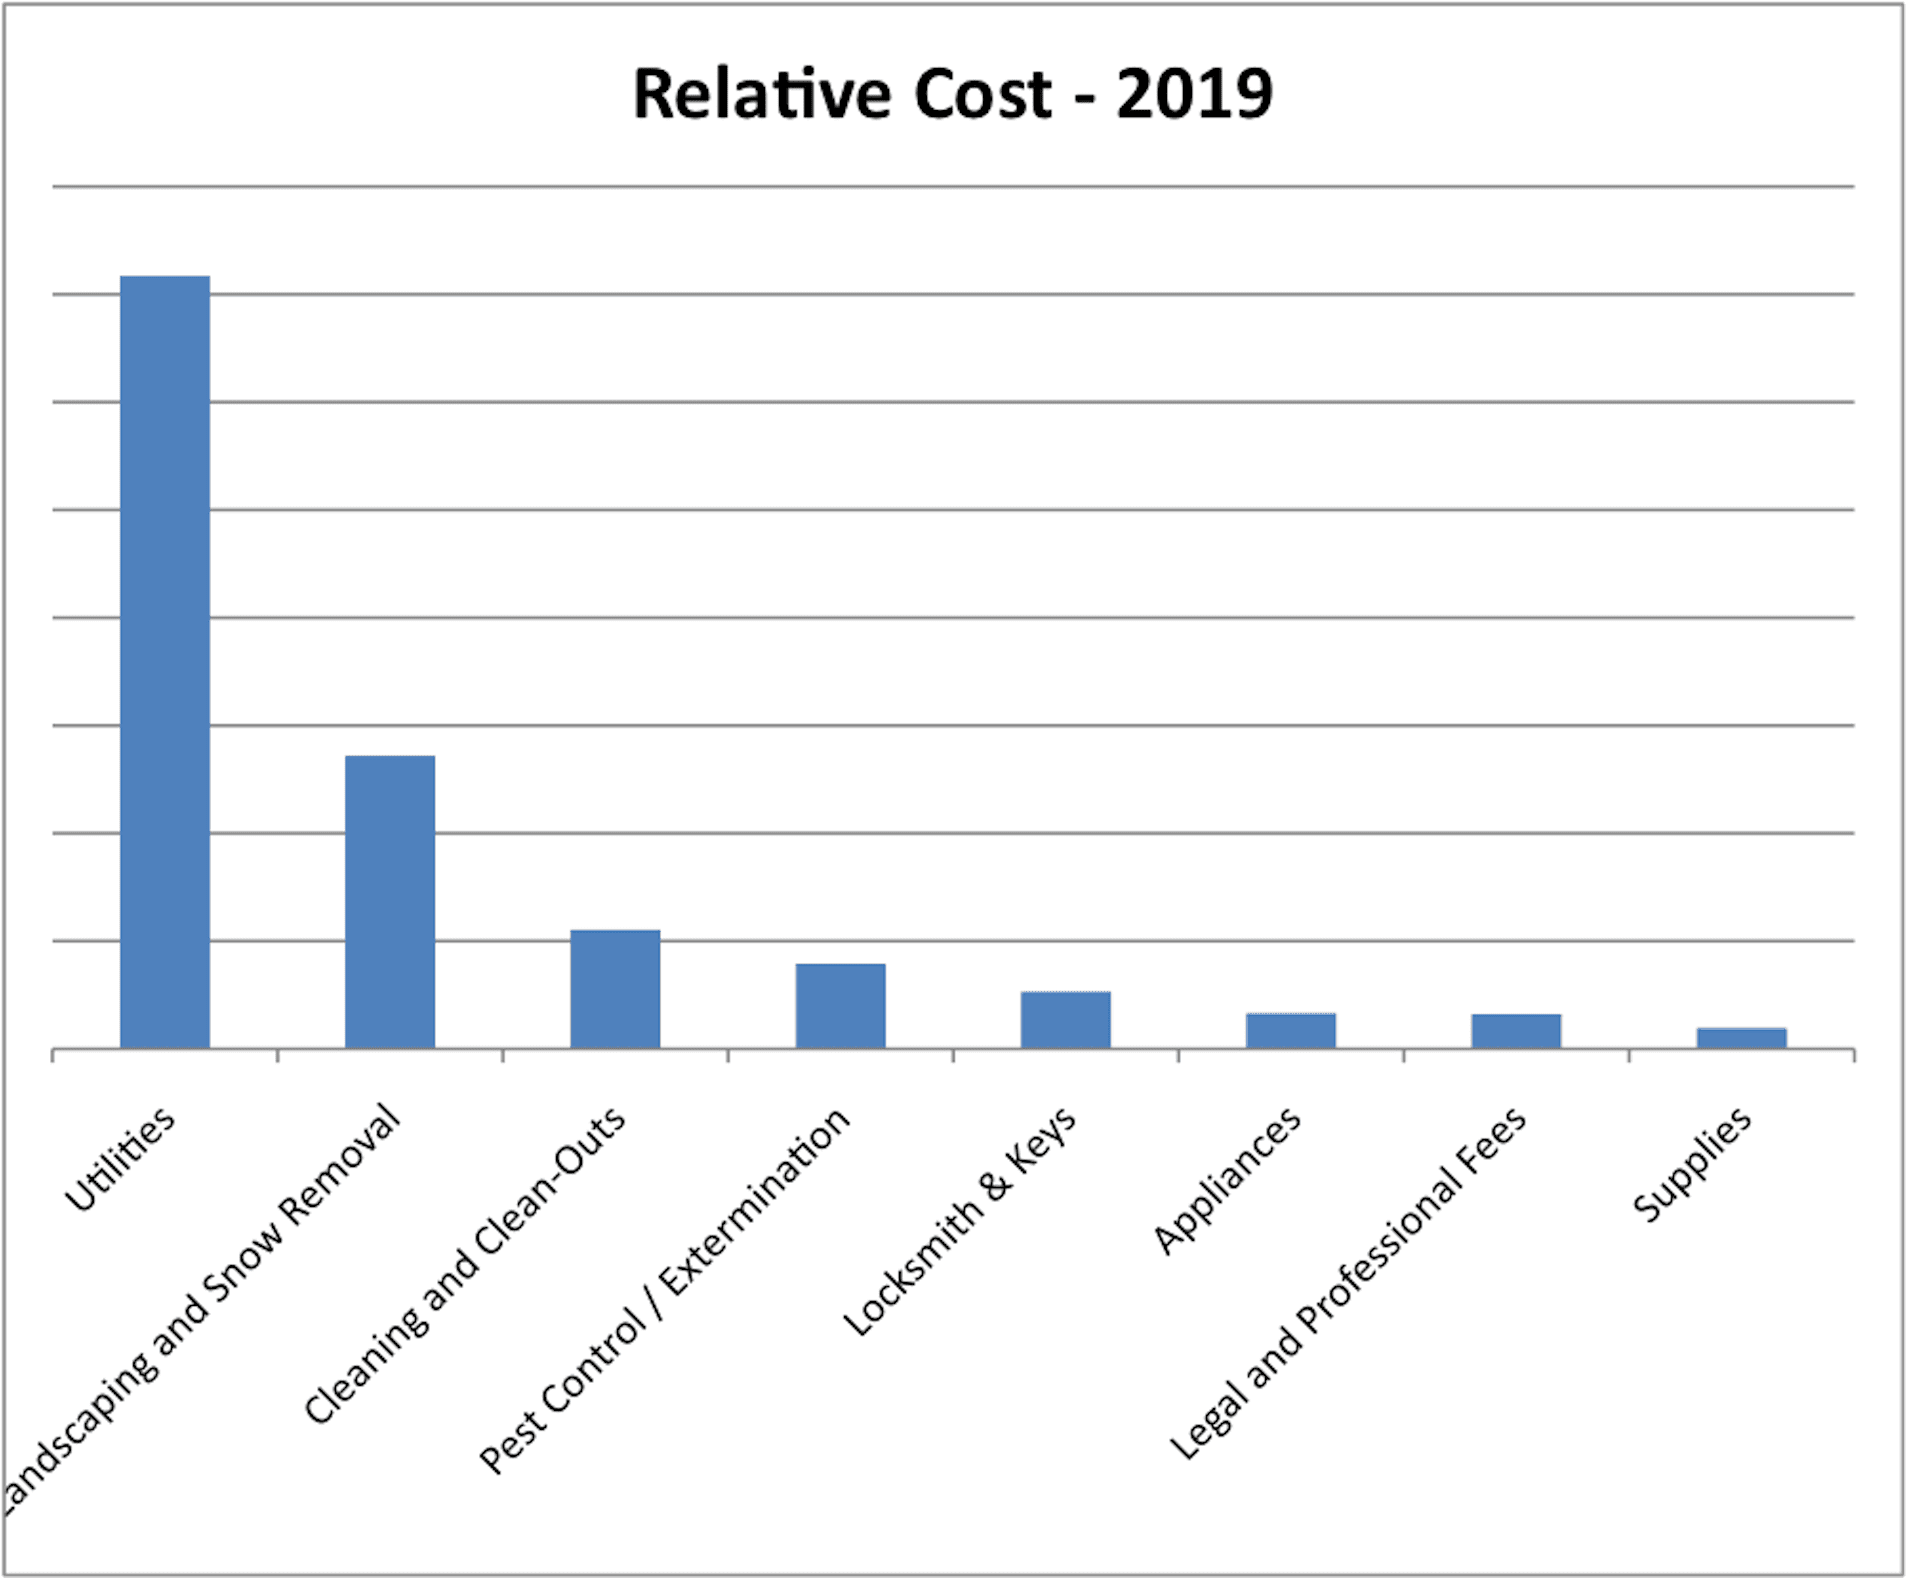
Utilities are dominant, although this can be misleading because utility cost is typically dominated by water/sewer, which is normally billed back to the tenants.
Landscaping is something that investors moving up from single family to multifamily often forget to include in their pro-forma. It is a significant factor as you can see, overall the 3rd highest category of spending. Snow removal (typically done at larger MF properties) is another one that investors who live in warm climates may forget to account for when purchasing property in the northern part of the US.
Cleaning and clean-outs are tied to turnover (which itself is the most expensive part of owning rental property, by far).
We caution against tying expenses to a percentage of rent, as this can be very misleading and does not tend to scale up or down at all (ie, expenses are not correlated with rent). A better way to estimate expenses is to calculate them on a per-square-foot basis.
Do you have any questions about spending at your property, or are you curious to know how we might predict costs at a property you are considering purchasing? Please get in touch.
